Image-based Visualization of Large Volumetric Data Using Moments
A compact representation of large volumetric datasets that supports interactive changes to the transfer function and limited changes to the viewing perspective.
Tobias Rapp, Christoph Peters, and Carsten Dachsbacher
Presented at PacificVis 2022, where the paper received an honorable mention. Published in IEEE Transactions on Visualization and Computer Graphics (2022).
Official version | Author’s version | Video | Supplementary document | Code
Introduction
Large simulation data can be prohibitively large to move to a workstation or render whenever a scientist changes the visualization. We built moment images to store a compact description of the scalar data along each pixel’s viewing ray. Once generated, the images can be transferred to a workstation, where the transfer function or viewing perspective can be changed without accessing the original simulation data.
In detail, we transform the density in each pixel to the Fourier basis and store Fourier coefficients of a bounded signal, i.e. bounded trigonometric moments. To keep this image-based representation compact, we adaptively determine the number of moments in each pixel and present a novel coding and quantization strategy.
How it works
Reconstructing a viewing ray
We ray march the dataset from a chosen camera and compute up to 100 Fourier coefficients, or moments, for the scalar signal along each pixel’s ray. Unlike a conventional rendered image, these coefficients describe the signal rather than its final color. At rendering time, a bounded maximum-entropy spectral estimate (MESE) reconstructs an approximate signal. We apply the chosen transfer function to that signal and composite the samples along the ray. The bounded reconstruction keeps values within the signal’s range and avoids some of the ringing artifacts of a truncated Fourier series.
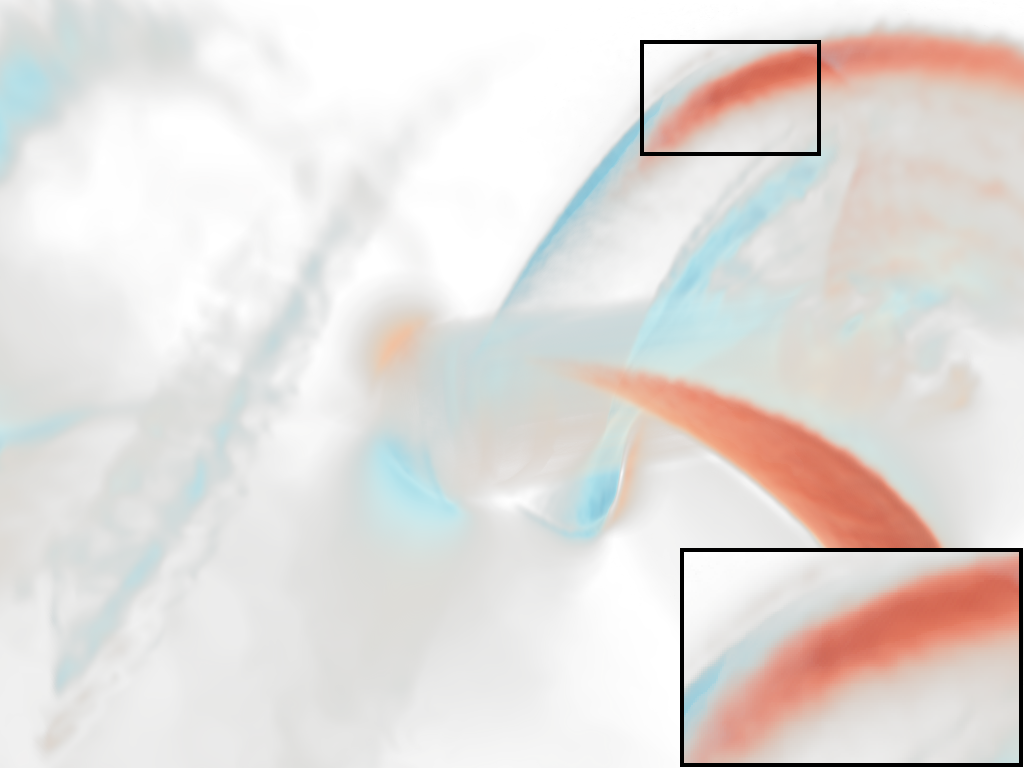
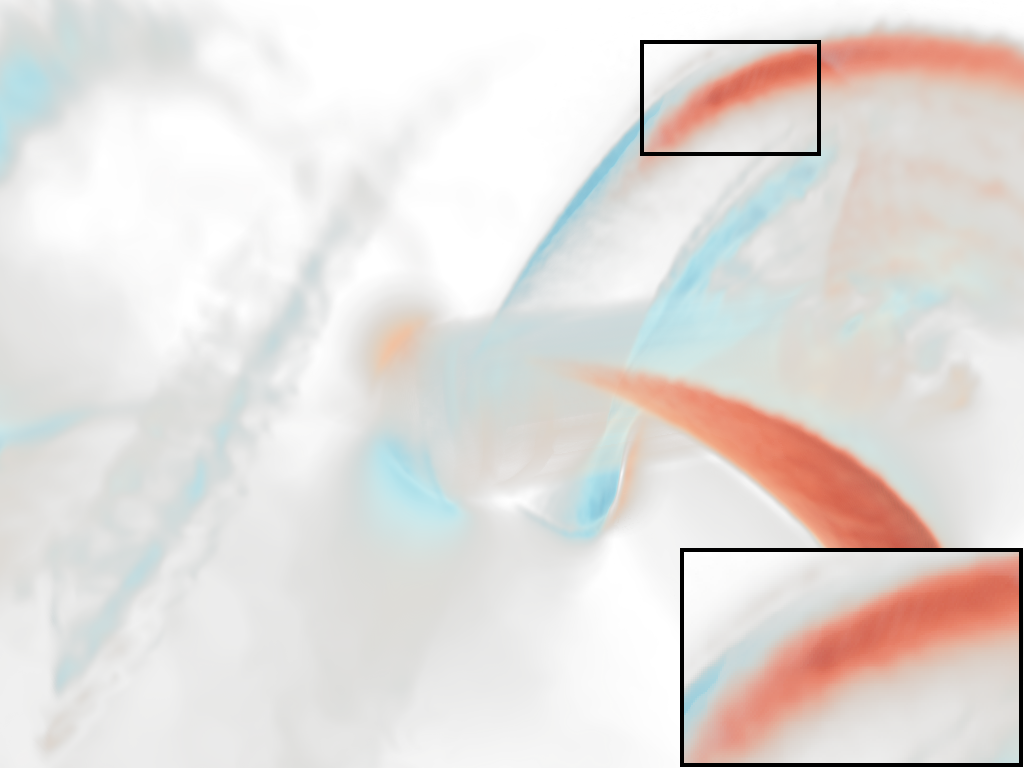
The images below use the same view and transfer function. The reference ray marches the original SPH particles; the reconstruction renders from a compressed moment image.
| Reference: direct ray marching | Reconstruction: bounded MESE |
|---|---|
 |
 |
Adapting the number of moments
Not every ray needs the full set of moments. For each pixel, we test shorter prefixes by predicting the omitted moments with the bounded MESE and comparing them with the computed moments. We retain a prefix that meets a chosen relative error threshold. This test reuses the moments already computed, so it does not require another pass through the simulation.
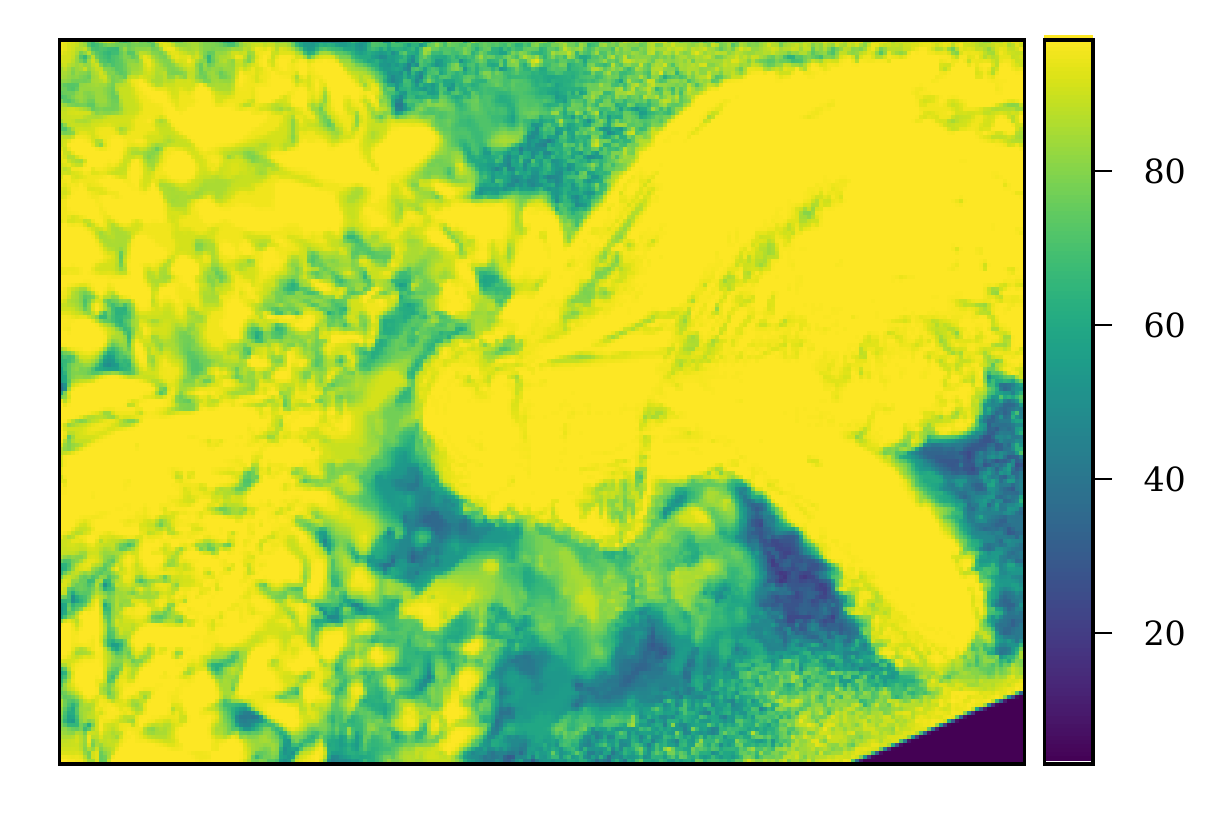
Retained moments per pixel. The turbine blades and turbulent regions generally require more coefficients, while simpler regions require fewer.
Coding, quantization, and uncertainty
Earlier moments constrain the possible values of later ones. Our coding scheme stores each later moment relative to a value predicted from its predecessors, making the data easier to quantize and compress. We assign a different number of bits to each moment index because quantization errors in early moments have a greater effect on the reconstruction. Arithmetic coding and LZ4 then reduce the file size further.
| Turbine moment image, 1024 × 768 pixels | Size |
|---|---|
| 100 moments per pixel, before reduction | 300 MB |
| After adaptive moment selection | 254 MB |
| After quantization | 62 MB |
| After lossless compression | 52 MB |
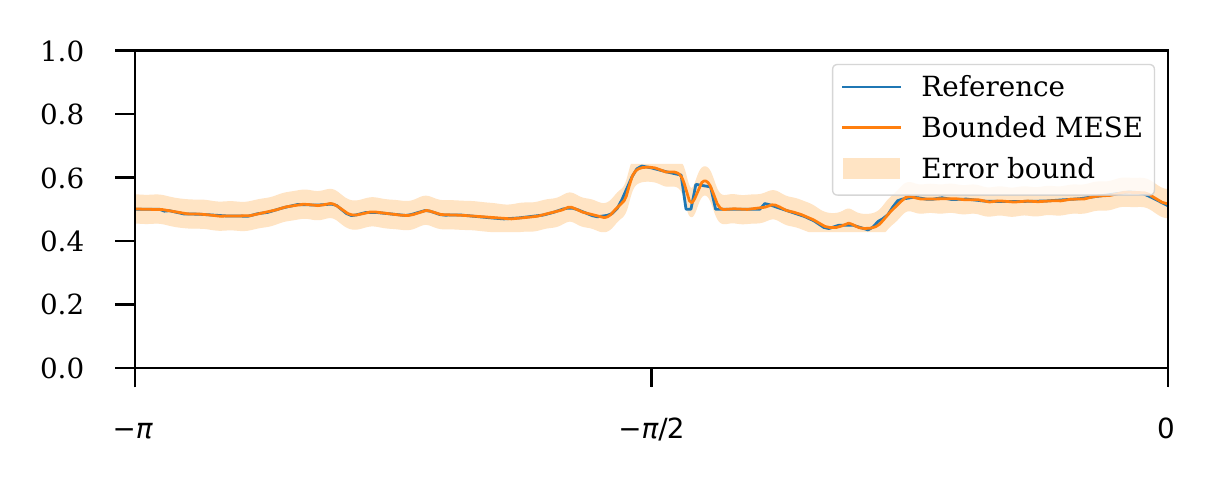
Compression loses information, so we can optionally estimate how much a reconstructed signal differs from the original. The plot shows one ray: the blue line is the reference signal, the orange line is its bounded MESE reconstruction, and the shaded region is an estimated percentile error band. Computing these error estimates requires another pass through the dataset.
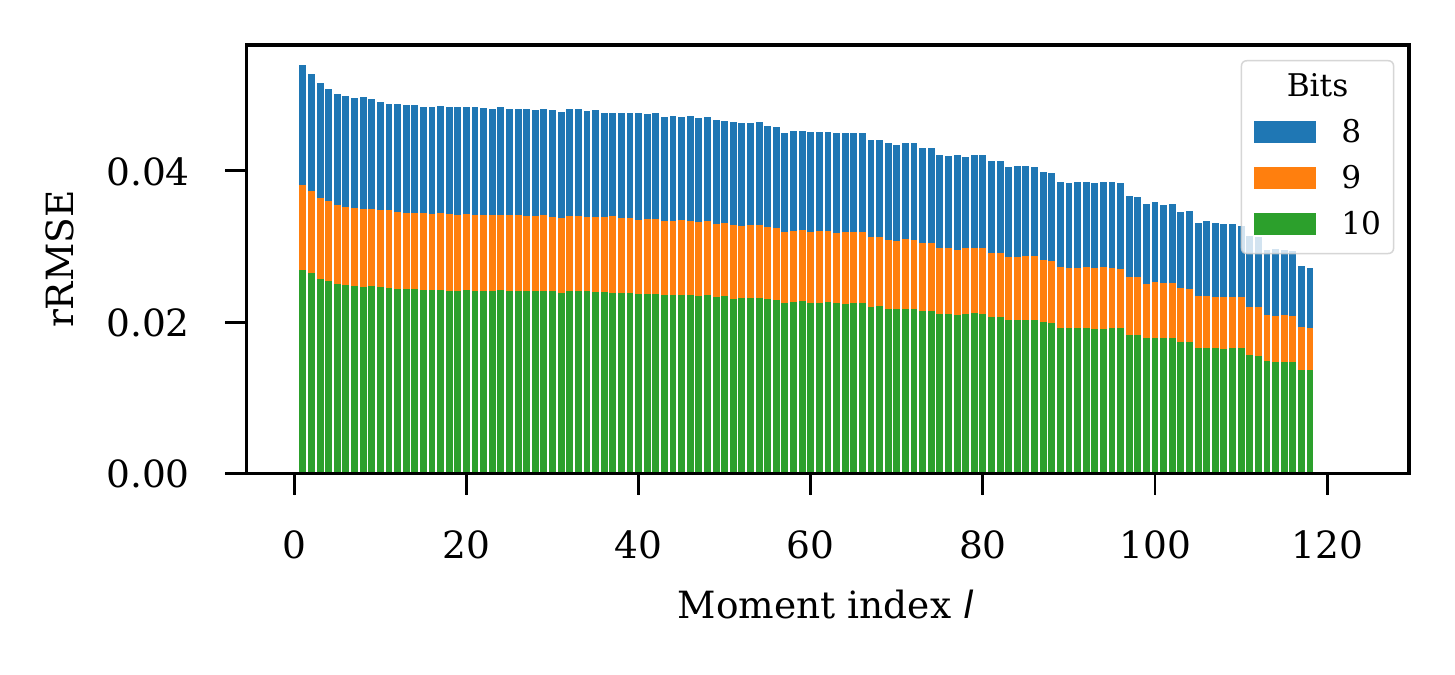
To choose the bit allocation, we quantize one moment index at a time and measure the resulting reconstruction error. The plot below shows how the error varies with the index and with 8, 9, or 10 bits. These measurements guide a quantization curve that assigns a bit count to each index.
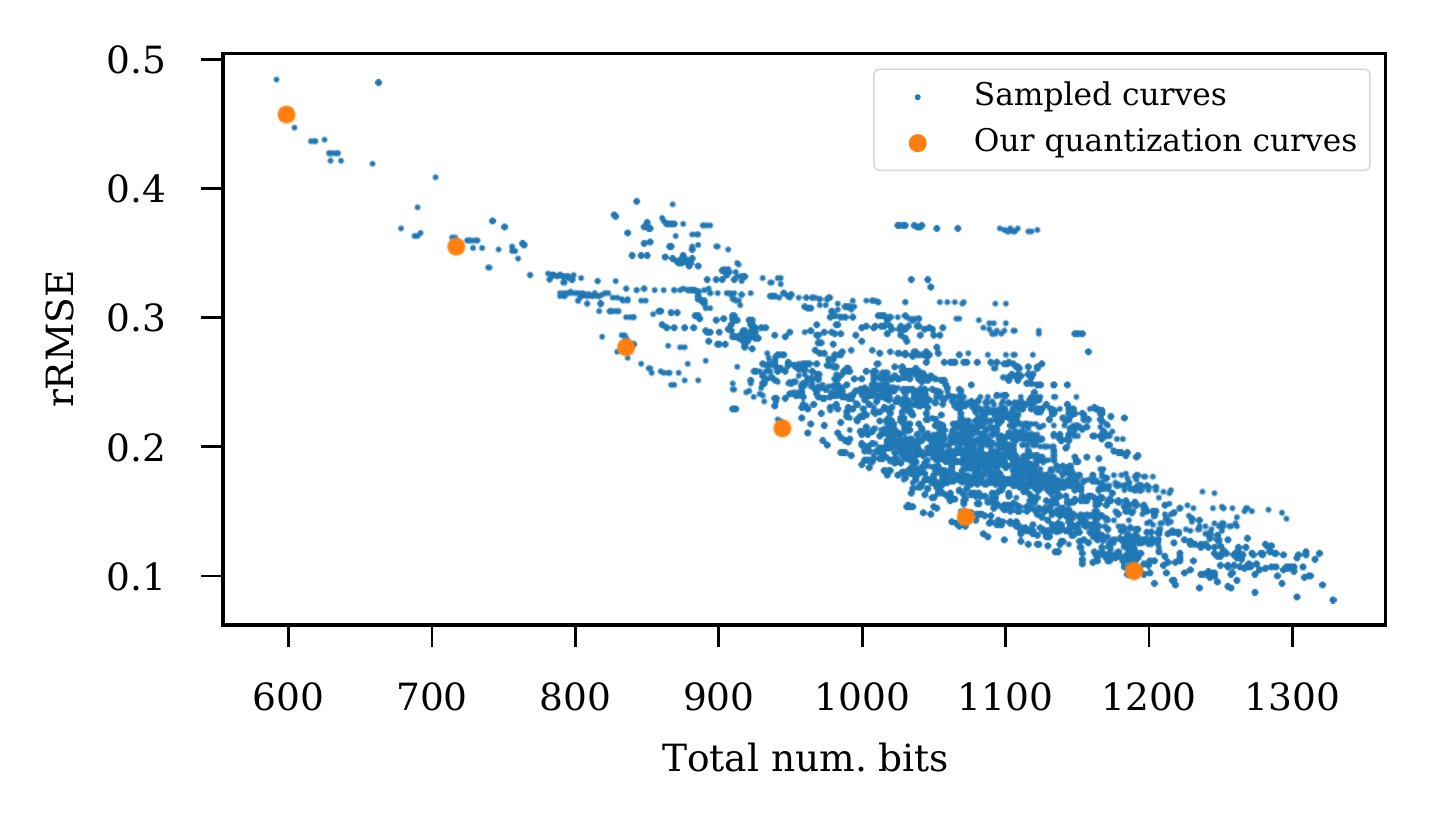
The final plot compares several of our quantization curves with randomly perturbed alternatives. Each point shows total bit count versus reconstruction error; lower and farther left are better. In this comparison, our curves lie on the Pareto frontier: none of the sampled alternatives improves both measures.
Moment images are designed around a chosen view. The paper also explores limited camera changes, but regions outside the captured view contain no data to reconstruct.